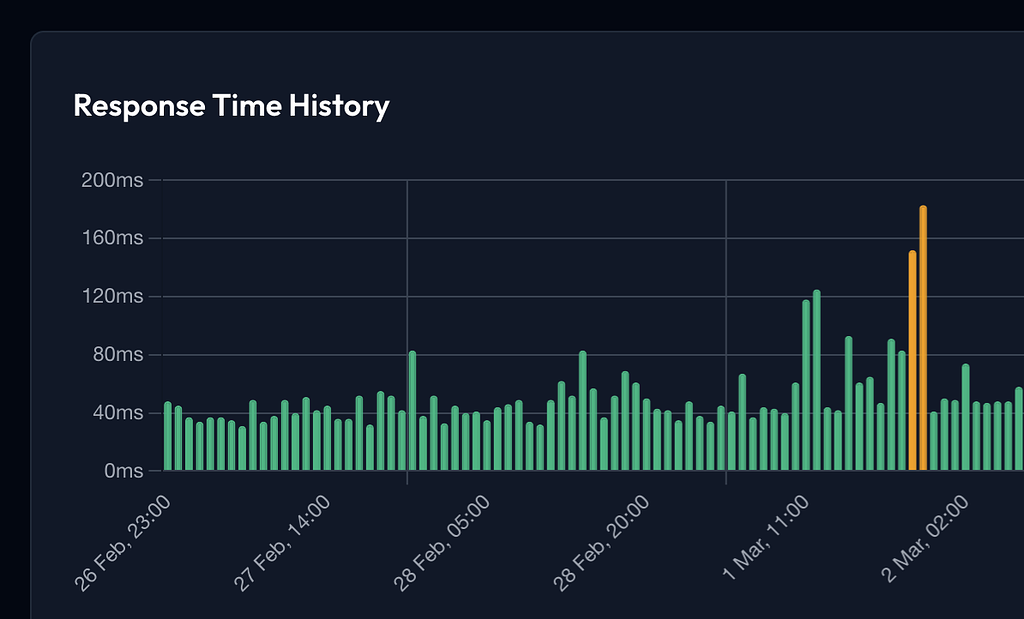
Uptime check timing breakdown

Uptime checks now capture detailed timing data for every request, giving you deeper visibility into where response time is spent.
Each check result now shows:
- DNS lookup time — how long it took to resolve the hostname
- Connect time — TCP connection and TLS handshake duration
- Time to first byte (TTFB) — how long the server took to start responding
- Resolved IP address — the exact IP your check connected to
These timings appear inline on every check result, making it easy to spot whether slowdowns are caused by DNS, network connectivity, or the server itself.
We've also improved the Run Now button so it always executes immediately, even if the check was recently run.
Uptime check timing breakdown
Uptime checks now capture detailed timing data for every request, giving you deeper visibility into where response time is spent.
Each check result now shows:
- DNS lookup time — how long it took to resolve the hostname
- Connect time — TCP connection and TLS handshake duration
- Time to first byte (TTFB) — how long the server took to start responding
- Resolved IP address — the exact IP your check connected to
These timings appear inline on every check result, making it easy to spot whether slowdowns are caused by DNS, network connectivity, or the server itself.
We've also improved the Run Now button so it always executes immediately, even if the check was recently run.